
-Durga Prasad Gautam
A vital national monitoring tool, the Multi-dimensional Poverty Index (MPI), measures poverty in Nepal’s national and local policy priorities for eradicating poverty with scientific precision. A measure of poverty that can be compared globally and has academic validation is the Multidimensional Poverty Index. It considers factors from nutrition, child mortality, years of schooling, housing, and assets in addition to income when examining poverty. The debate on national development in Nepal now includes the concept of MPI, and this is reflected in its development objectives. The 15th Development Plan currently aims to reduce MPI from 28.6% to 11.5%. The Multidimensional Poverty Index Report 2021, the second edition, was published by Nepal’s National Planning Commission.
In terms of lowering MPI, Nepal has achieved great progress. According to national poverty statistics, the prevalence of multidimensional poverty decreased from 30.1% in 2014 to 17.4% in 2019. The MPI was 0.074 in 2019. In five years, 3.1 million people have therefore been lifted out of poverty. From 44.2 percent to 42.5 percent, the severity of multidimensional poverty also dramatically decreased. The majority of individuals lack suitable housing, clean cooking fuel, years of schooling, assets, and nutrition when all the factors are taken into account. Years of schooling and nutritional deprivation are the key contributors to Nepal’s ongoing multidimensional poverty, according the indicator weights.
According to the research, 12.3 percent of urban residents and 28 percent of rural residents, respectively, are MPI poor. Rural areas are where most of Nepal’s poor people live.. In addition, Karnali Province has the greatest percentage of MPI poor people (39.5%), followed by Sudoorpashchim Province (25.3%) and Province 2 (24.2%). With an incidence of about (7.0%) one sixth that of Karnali Province, Bagmati Province has the lowest level and incidence of poverty.. In Gandaki Province, 9.6% of the population is multidimensional poor.

According to Figure 1, MPI are broken down into two age groups: the population of adults (18+) and children (0–17). Nearly 36% of kids experienced multidimensional poverty in 2014. By 2019, 22% of all children were still living in poverty, a significant and encouraging decline of 14 percentage points. However, there are still 2.2 million children who live in poverty, making them the poorest age group.
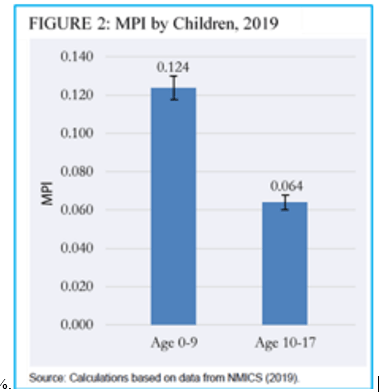
The effects of poverty are disproportionately felt by children in Nepal. A little more than 35% of people, or 44% of people, are considered to be poor. Of all youngsters, 21.8 percent compared to 15.1% of the adult population, living in multidimensional poverty. Both of these age ranges are further broken down into early childhood (ages 0–9) and adolescence (ages 10–17). Figure 2 displays the MPI for households with children under the age of 10, which is 0.124, together with the incidence (H) and intensity (A) of poverty. In contrast, the MPI for households with adolescents is 0.064, with a poverty incidence of 14.9% and a poverty intensity of 43.0%.
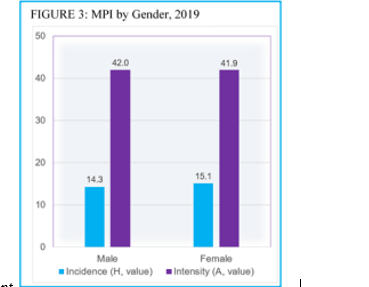
Males make up 47.3% of Nepal’s population, while females make up 52.7 percent. Using prior approach, Nepal MPI 2019 has determined that 15.1 percent of the female population and 14.3 percent of the male population, respectively, experience multidimensional poverty (H). This demonstrates that whereas a poor woman’s predicted level of poverty is 41.9 percent, a poor man’s average level of poverty (A), which reflects the proportion of deprivation that each poor man suffers on average, is expected to be 42.0 percent.
A person with a disability is defined as having very high levels of difficulty in at least one of the following domains: communication, self-care, walking or ascending stairs, walking or hearing, remembering or focusing. Roughly 3.2 percent of people live in a household where one of the members has a disability. These families have an MPI of 0.083, which is somewhat higher than the national average, and a poverty incidence (H) and intensity (A) of 18.3 percent and 45.5%, respectively. However, an important pattern in these results suggests that these homes may genuinely be more deprived than others.
Except for the Maldives, Bangladesh’s 2019 MPI value of 0.104, which was likewise determined using information from an NMICS survey, is higher than Nepal’s 2019 MPI value of 0.074. It is also lower than the MPI figures for all other South Asian nations. Nepal’s MPI is comparable to that of Botswana (2015–16), one of the least impoverished nations in Sub-Saharan Africa, Nicaragua (2011–12) in Latin America, Kiribati (2018–19 NMICS) in East Asia and the Pacific, and Nicaragua (2011–12).
Although the MPI for Nepal was developed using NMICS data from 2019, which was before to the pandemic. However, the report used the NMICS dataset to evaluate additional pandemic-related deprivations. The research amply indicates the value added of looking at deprivations one at a time, with 18 million people having at least one of the vulnerability-to-disease deprivations taken into account in the paper.
Two subgroups of vulnerable people—the 4.9 million who are growing vulnerable and the 375 thousand who are severely vulnerable—emerge when their overlap between deprivations is taken into account. The importance of taking into account such overlaps of vulnerability-to-disease indicators cannot be overstated for targeted efforts that aim to prioritize the most vulnerable.
( Principal at Arya Academy Nagarjun-4 ktm)


